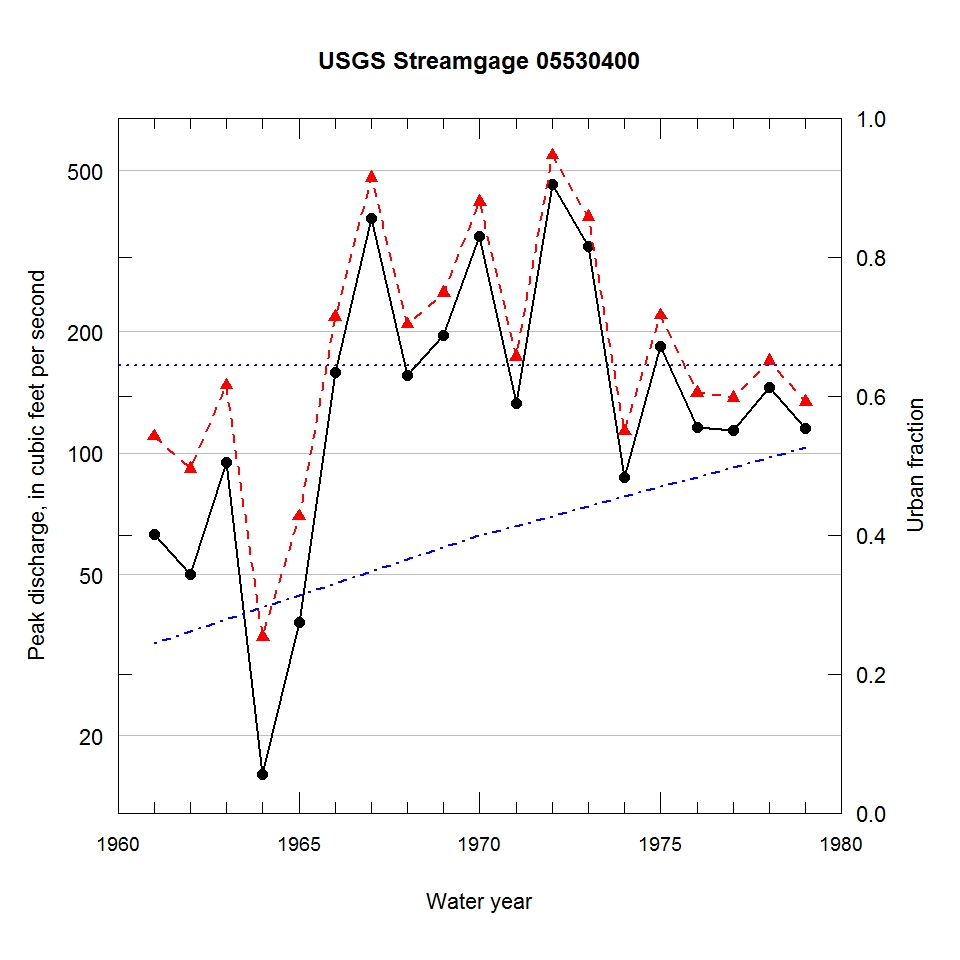
Observed and urbanization-adjusted annual maximum peak discharge and associated urban fraction and precipitation values at USGS streamgage:
05530400 HIGGINS CREEK NEAR MOUNT PROSPECT, IL


| Water year | Segment | Discharge code | Cumulative reservoir storage (acre-feet) | Urban fraction | Precipitation (inches) | Observed peak discharge (ft3/s) | Adjusted peak discharge (ft3/s) | Exceedance probability |
| 1961 | 1 | -- | 0 | 0.244 | 2.199 | 63 | 110 | 0.828 |
| 1962 | 1 | 2 | 0 | 0.261 | 0.130 | 50 | 91 | 0.903 |
| 1963 | 1 | -- | 0 | 0.279 | 0.353 | 95 | 147 | 0.643 |
| 1964 | 1 | -- | 0 | 0.296 | 0.806 | 16 | 35 | 1.000 |
| 1965 | 1 | -- | 0 | 0.313 | 0.149 | 38 | 70 | 0.954 |
| 1966 | 1 | -- | 0 | 0.330 | 1.419 | 158 | 217 | 0.301 |
| 1967 | 1 | -- | 0 | 0.347 | 1.540 | 382 | 480 | 0.021 |
| 1968 | 1 | -- | 0 | 0.365 | 1.298 | 156 | 208 | 0.337 |
| 1969 | 1 | -- | 0 | 0.382 | 1.298 | 195 | 249 | 0.197 |
| 1970 | 1 | 2 | 0 | 0.399 | 1.252 | 343 | 419 | 0.036 |
| 1971 | 1 | 2 | 0 | 0.413 | 0.622 | 133 | 173 | 0.506 |
| 1972 | 1 | -- | 0 | 0.427 | 1.064 | 463 | 545 | 0.016 |
| 1973 | 1 | -- | 0 | 0.441 | 0.809 | 324 | 384 | 0.047 |
| 1974 | 1 | -- | 0 | 0.455 | 0.495 | 87 | 113 | 0.816 |
| 1975 | 1 | -- | 0 | 0.469 | 1.042 | 184 | 219 | 0.291 |
| 1976 | 1 | -- | 0 | 0.484 | 0.905 | 116 | 141 | 0.676 |
| 1977 | 1 | -- | 0 | 0.498 | 1.123 | 114 | 137 | 0.702 |
| 1978 | 1 | -- | 0 | 0.512 | 1.540 | 145 | 169 | 0.527 |
| 1979 | 1 | -- | 0 | 0.526 | 0.875 | 115 | 134 | 0.718 |

